Monitoring
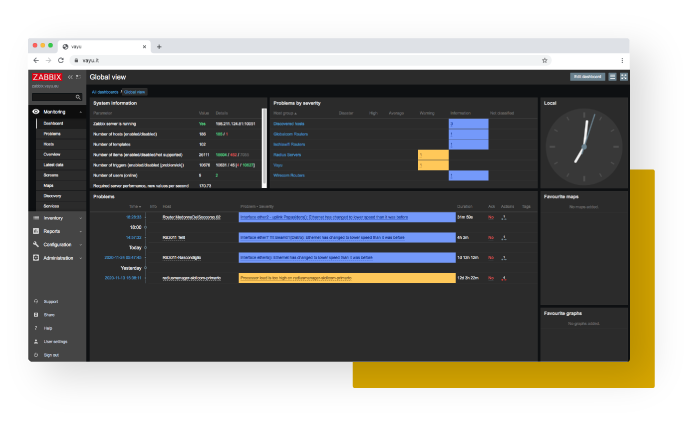
Everything is under control. In a complex system, outages and anomalies are frequent. Always having the situation under control could be an issue. That’s why we offer our monitoring solution for your network infrastructure that makes Zabbix, Grafana and Graylog working together.

Let the system guide you
To achieve a reliability and stability value approaching 100%, it’s not enough to just react to failures, but also to anticipate by monitoring indicators and symptoms that could forecast issues.
Want to learn more about Vayu Monitoring?
Why choose Vayu Monitoring?

A dashboard for the health of the network infrastructure
Custom alerts for faults and anomalies
Integration with devices and actuators to create your Control Room
Monitor. View. Relax.
Anticipate infrastructure issues by monitoring all systems, devices, traffic and applications in your IT infrastructure.
Determine how much bandwidth your devices and applications are using and identify potential bottlenecks. Manage all your applications, receive detailed statistics on each active application on your network. Monitor all types of servers in real-time in terms of availability, accessibility, capacity, and reliability.
Monitoring Features and Characteristics
1.
Data Collection
The first step is collecting data from all network elements, whether they are servers, customer premises equipment (CPE), routers, or simple switches.
Analysis & Detection
The collected data are saved and analyzed using a set of triggers and anomaly detection algorithms.
2.
Alert and Notification
Problems or potential issues are notified through various channels such as email, Telegram, and others.
Automatic reaction
For certain types of problems, actions can go beyond notifications. These actions may include service restarts or modifications of routing rules.